Dashboard
Key features
- Get an overview of total sales for the day, the week, or the past month
- See the average order value, number of orders, and revenue for the selected period
- Track the latest orders with their date, order ID, value, and state
- See the most sold products to spot what's trending right now
Quick guide
- Log in to Merchant Center to open the Dashboard.
- Choose a period (day, week, or month) to view the sales figures.
- Review the latest orders and their current state.
- Check Most sold products to see what's trending.
The date dimension is based on the order placement date, showing what customers intended to buy, including any canceled orders or products. All amounts are shown excluding tax.
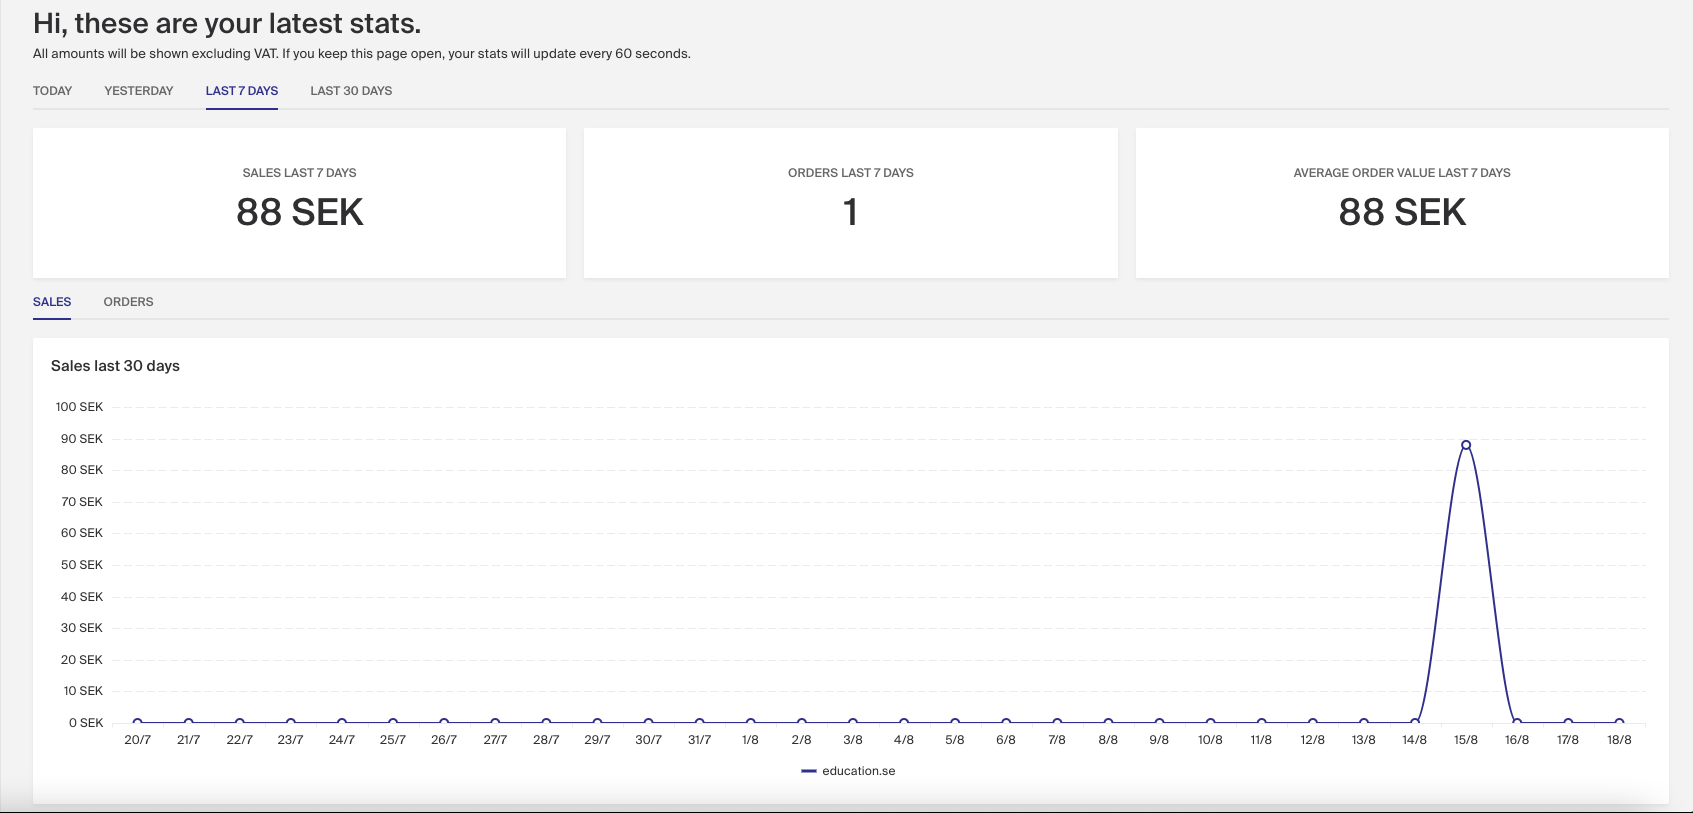
You can see the total sales for the day, the week or the past month and also get an overview of the average order value, number of orders and the amount the orders generated during the selected period.
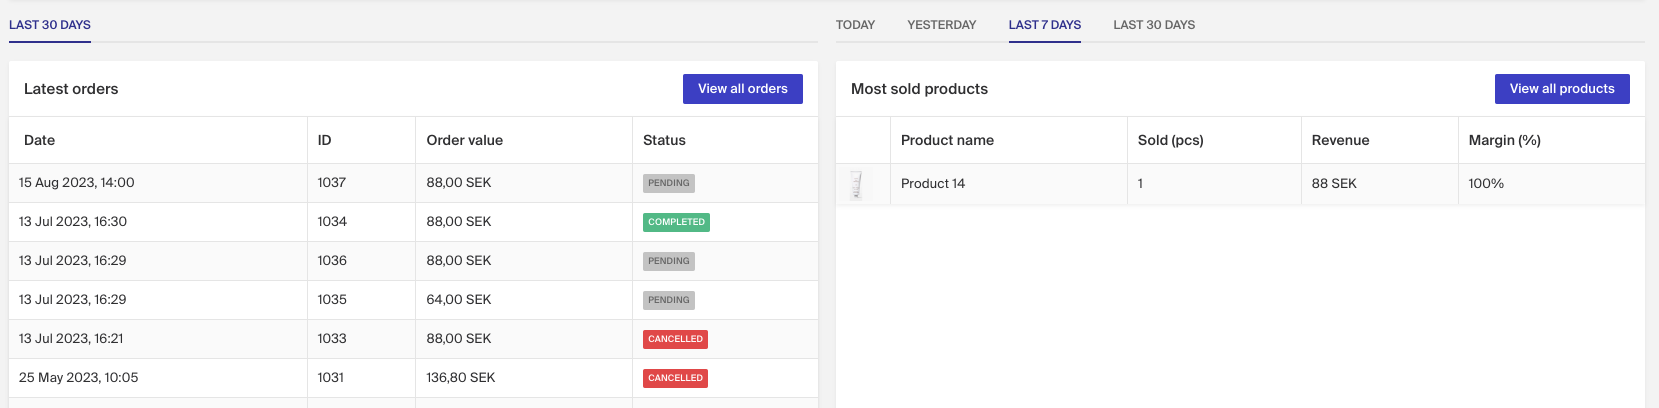
You may also see an overview of the latest orders, which date they were created, the order ID, the order value and which state the order is in: Pending, Completed, Returned, Cancelled, and Backorder.
To the right you can see the Most sold products, which gives you an overview of which products are trending right now: how many items sold per product, the revenue on each product, and the % margin you have on each product. This could be an inspirational source for campaigns.
Export functionality
You can utilize the grid in Merchant Center to customize your exports, ensuring you receive the specific information you need.
How to add a new administrator in Merchant Center
When you want to add a colleague as an administrator in Merchant Center, simply go to Settings > Administrators in the left menu.